Desktop App
Welcome to the Cloudica™ Desktop App Quick Guide! This tool helps monitor and enhance the productivity of remote users by capturing essential data. Follow this guide to ensure a smooth experience.
Installation
- Download: Get the Cloudica™ Desktop App installer.
- Install: Open the installer and follow the on-screen instructions.
- Set Up Permissions: After installation, complete the initial permission setup. Refer to our Windows or macOS guides for proper configuration.
Parts of the Desktop App
The Desktop App has three main sections:
- User Header
- Left Panel
- Feeds Panel
User Header
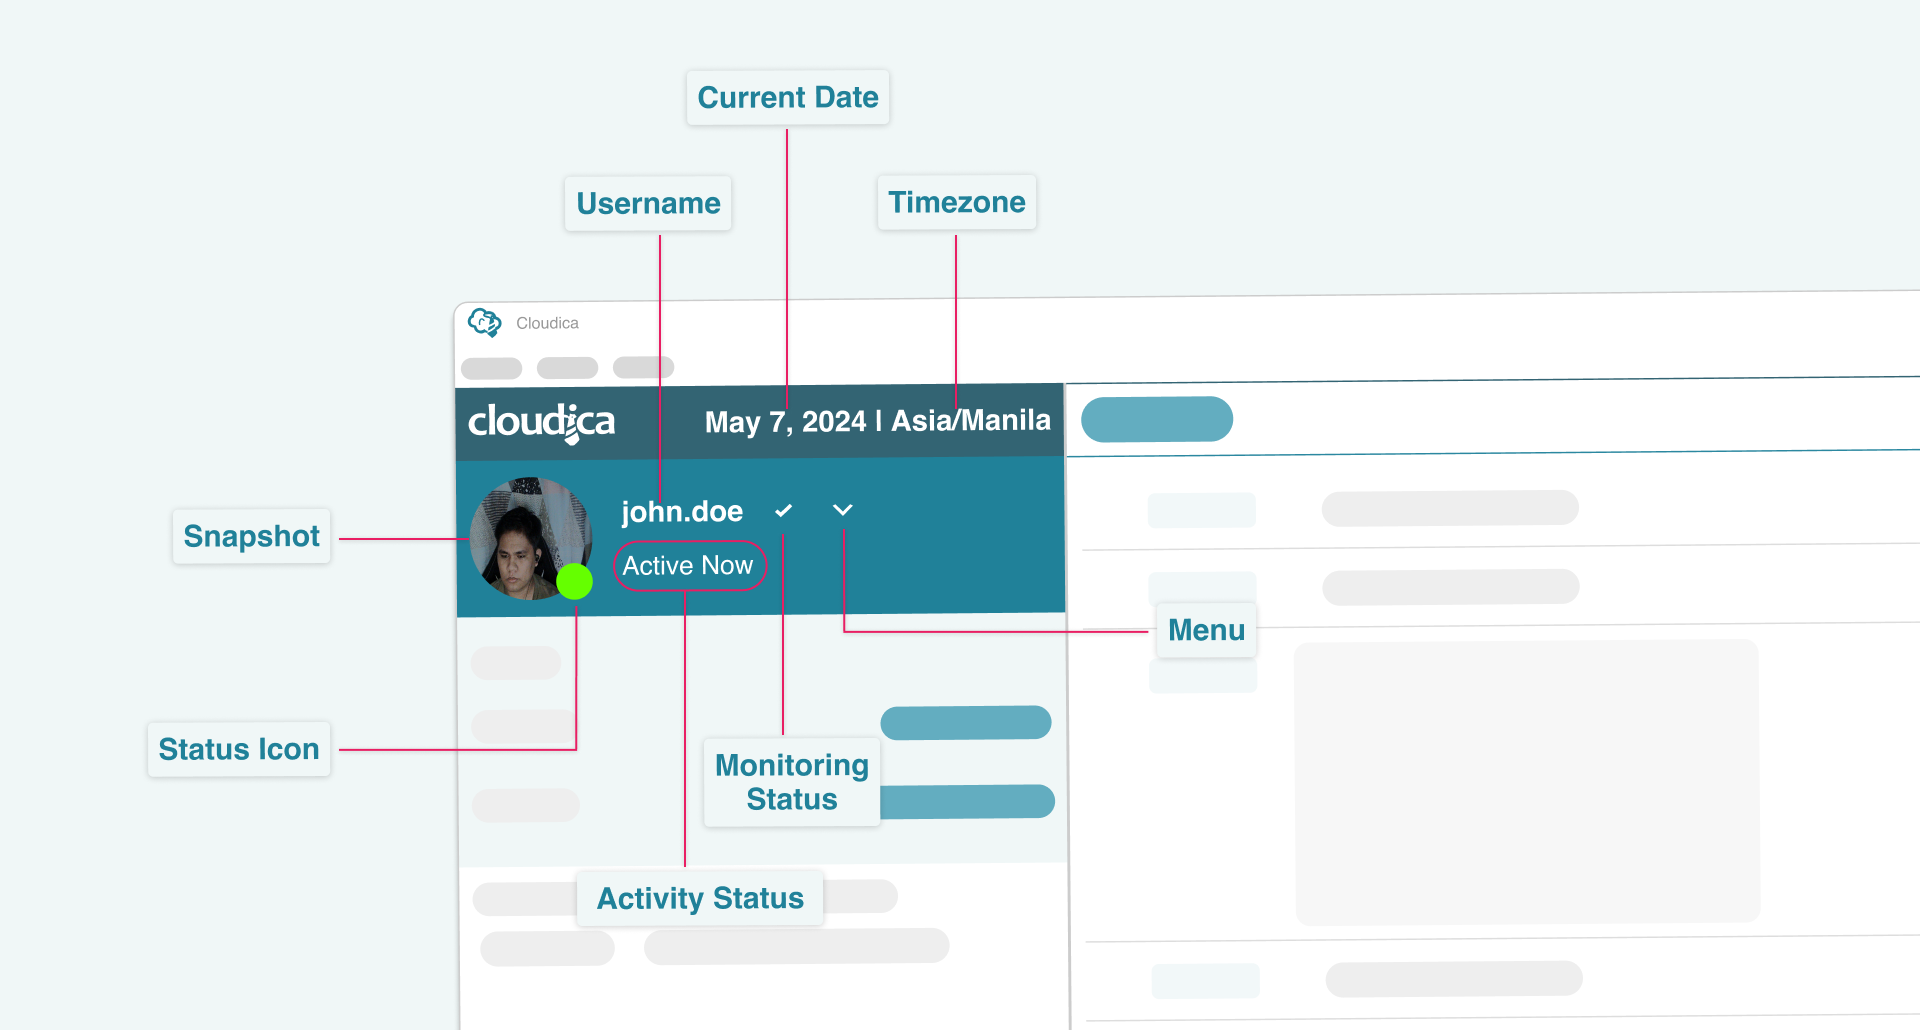
The User Header provides key information and controls:
- Snapshot Displays the most recent snapshot taken by the app.
- Status Icon Indicates whether you are online (green) or offline (white).
- Username Shows the currently logged-in user.
- Activity Status Indicates whether the computer is active or idle.
- Monitoring Status Icon Displays your monitoring mode (Monitoring, Confidential, Incognito).
- Menu Access options to change monitoring status, sign out, or exit the app.
- Current Date & Timezone Displays the current date and your company’s timezone.
 Left Panel
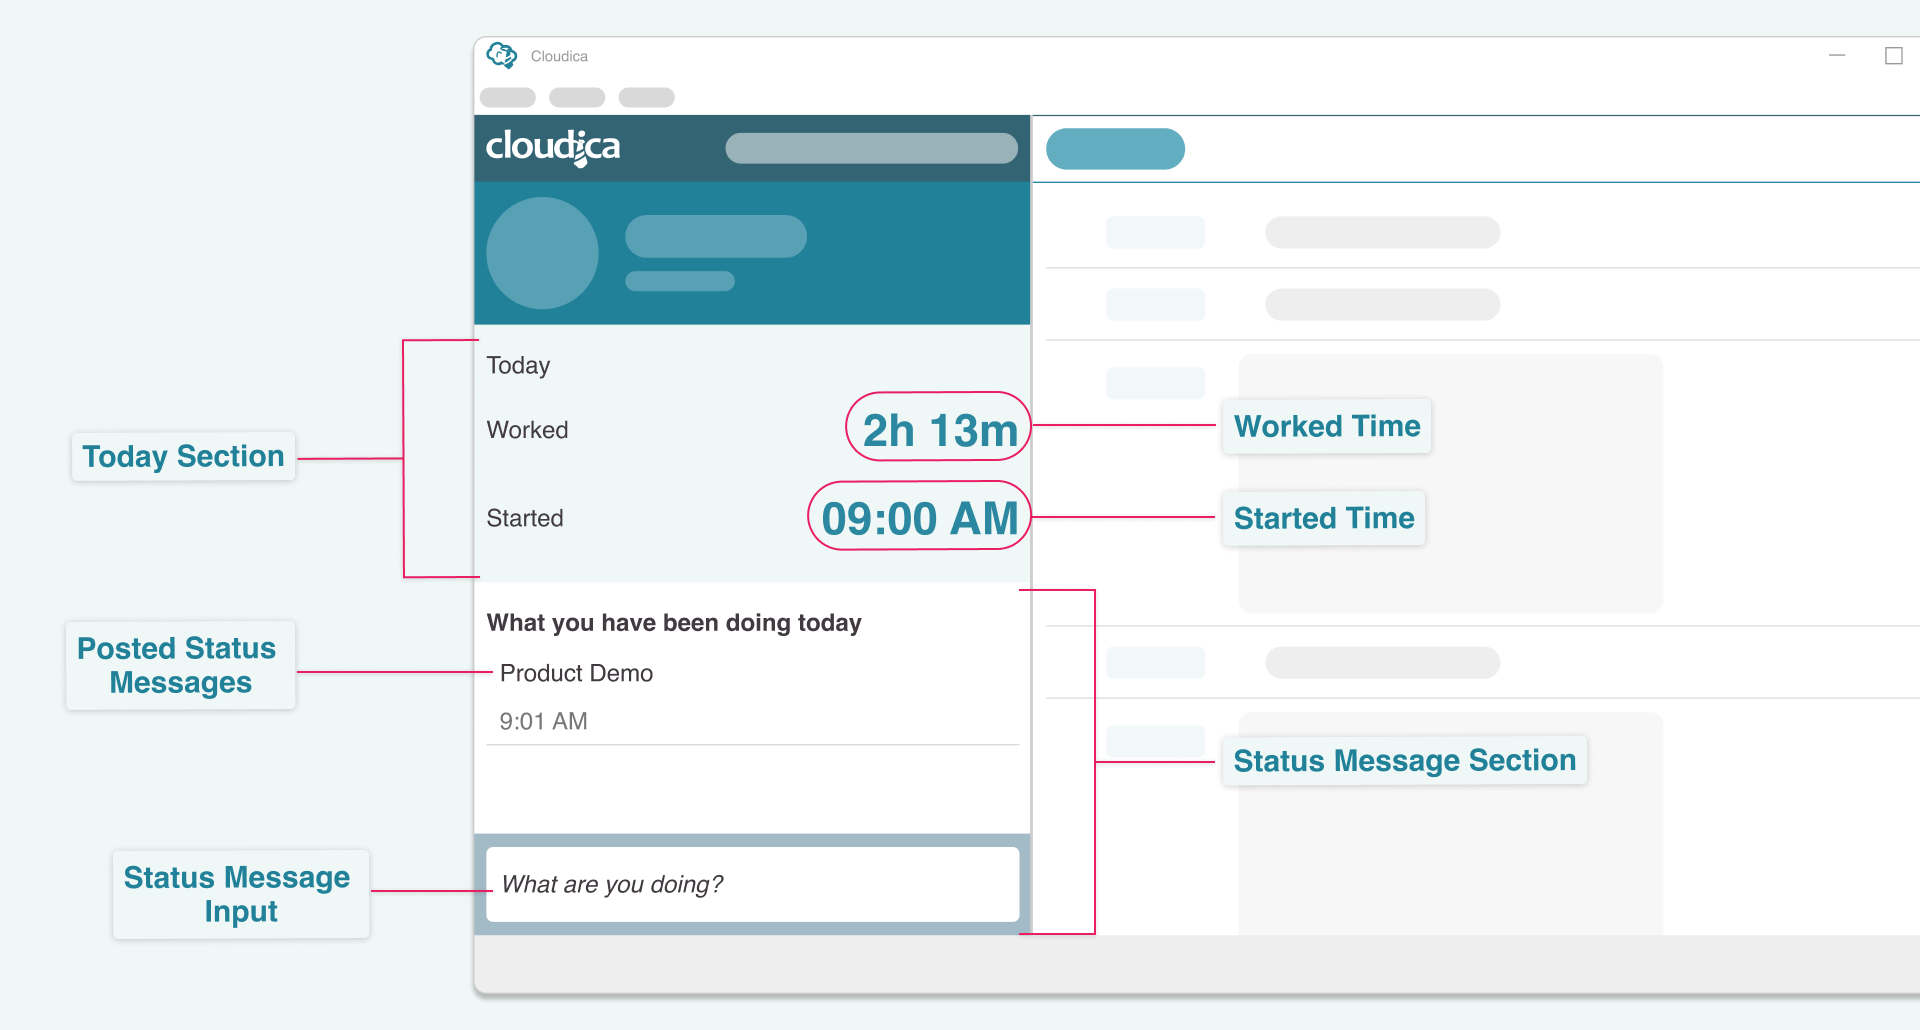
Located beneath the User Header, the Left Panel consists of two sections:
Today Section:
- Worked Time Tracks the total duration the Desktop App has monitored your activity.
- Started Time Records the time you first logged into the app for the day.
Status Message Section:
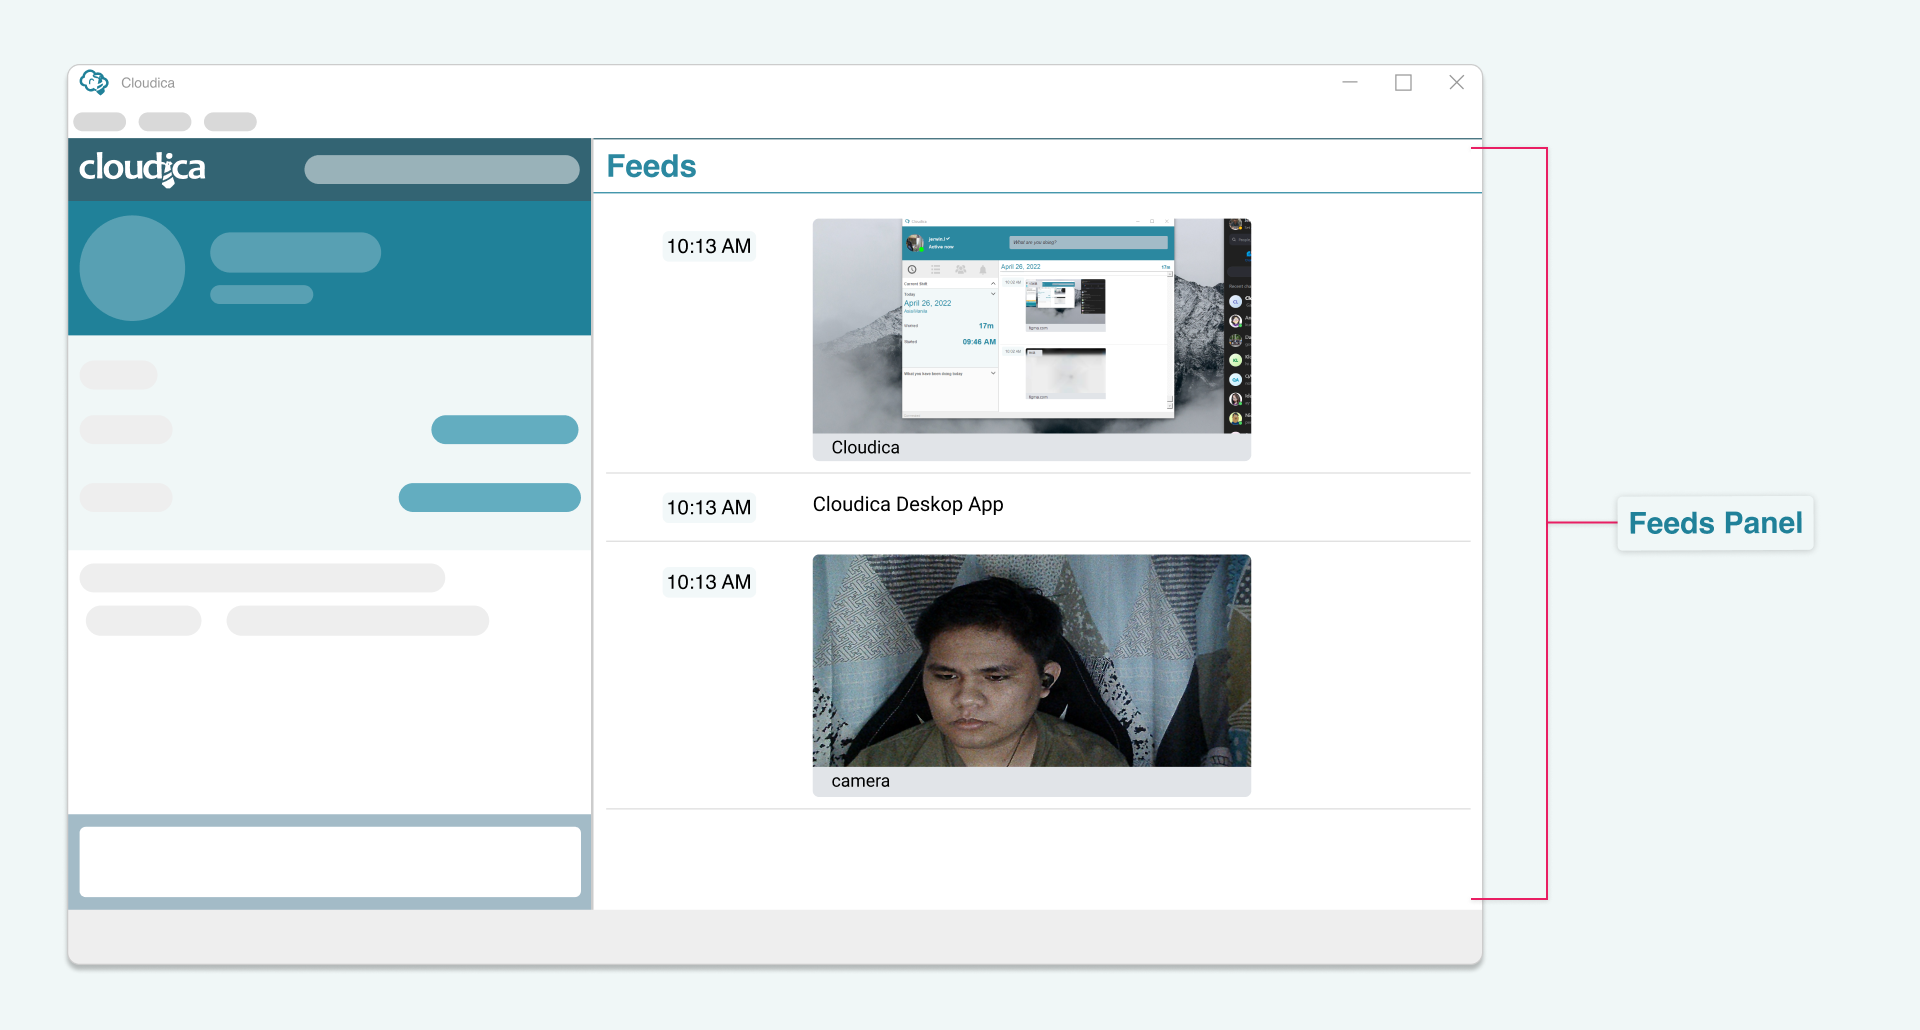
 Feeds Panel
On the right side of the Cloudica™ Desktop App, the Feeds Panel provides real-time data captured by the application. The following information is displayed:
- Snapshots
- App/Window Screenshots
- Fullscreen Screenshots
- Keystrokes
- App Names
- URLs
- Idle Time
 All captured data is securely stored and curated in the Cloudica™ Web Dashboard for further analysis and monitoring.
- Posted Status Messages Shows status messages posted during your day. Edit or remove messages as needed.
- Status Message Input Write your current status or activity. Can also be posted from the Cloudica™ web dashboard.
Copyright © 2025 Cloudica LLC
