Navigating the Work Summary What is the Work Summary? The Work Summary is a visual representation of the data captured throughout your workday by Cloudica™. It displays key metrics like Worked Time, Idle Time, Applications Used, Keystrokes, and Screenshots in a timeline format, allowing you to track and review your daily productivity. 66e7e9704a069Image - Work Summary.png How to Access the Work Summary To access the Work Summary of the Daily Reports Module from the Cloudica™ Application Dashboard:
  • Click on the User Menu. 
  • Select "My Daily Reports" from the menu.
Work Summary Views The Work Summary can be viewed in two formats:
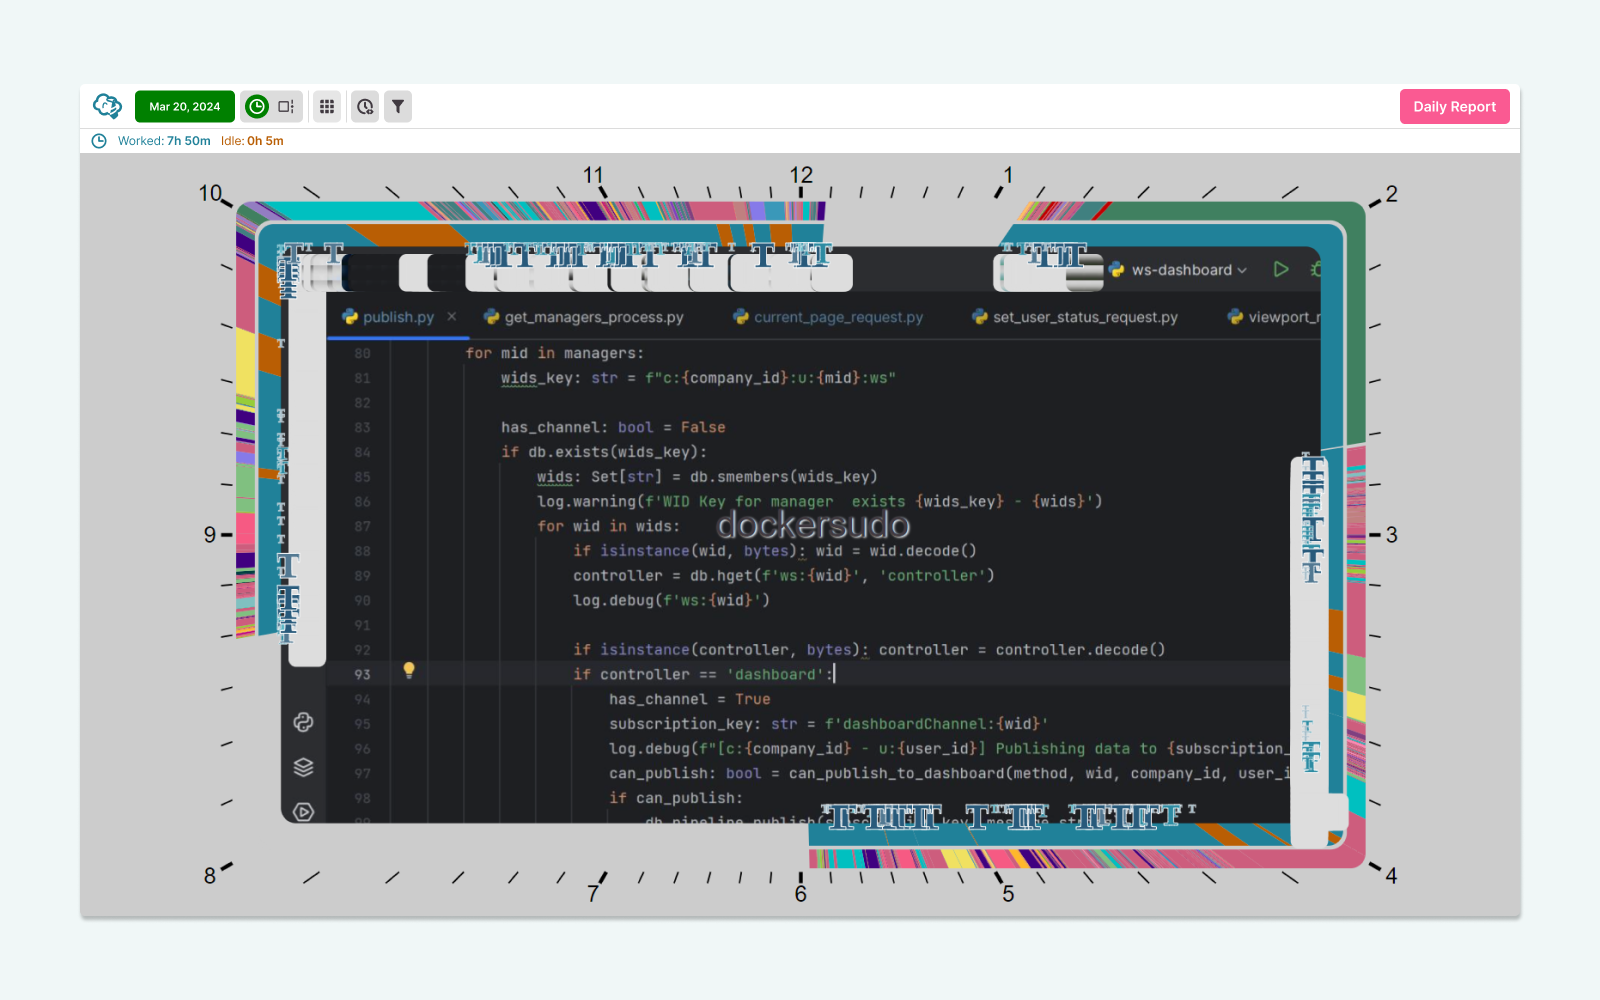
  • View as Clock: The default setting that presents your work data in a circular, clock-style layout for a clear overview of how time was distributed throughout the day. 
  • View as Timeline: A linear, vertical representation of your work data. This format is ideal for users who prefer a chronological breakdown of their activities. 
66e7ea8380752Gif timeline view.gif You can easily switch between these views by clicking the toggle button. Parts of the Work Summary Depending on whether you choose the Clock or Timeline view, the Work Summary provides the following graphical elements: 66e7ea89528c6Image - parts of Work Summary.png Application Screenshots: Hover over the screenshots bar to view a specific screenshot along with the time it was captured and the application in use. This is a quick way to visually review your work. Keystrokes: Keystroke icons on the graph represent periods of active typing. Hover over these symbols to see what was typed, when, and how many keystrokes were captured. The corresponding details appear in front of the screenshot display and the sub-header.  Applications Used: Each colored bar represents a different application. The length of the bar indicates how long the application was used during the day. Hover over the bars for detailed information. Worked Time: The Worked Time is displayed in teal bars. Clicking the Worked Time bar will filter the graph to show only the data related to that time period.  Idle Time: The Idle Time is shown as orange bars interspersed with the Worked Time bars. Clicking an Idle Time bar filters the graph to show only data from idle periods.  Filtering the Data in the Work Summary 66e7ebbe7273aImage - Work summary filters.png Application Filter To focus on specific applications, click the Application Filter in the header. This activates a dropdown menu where you can select the applications you want to analyze. The graph will update to display only data for the selected apps. Time Range Filter When you activate the Time Range Filter, Start and End Time inputs appear in the header, along with a Time Range Slider in the Clock View graph. These tools help you narrow down the data to a specific time period.
  • Using the Time Range Input: Enter the start and end times directly in the header to filter the data for that time range. 
  • Using the Time Range Slider: Drag the white dot to set the start time and the pink dot to set the end time. This allows you to visually select a portion of the workday to review. 
Date Picker The Date Picker allows you to view past Work Summaries. Simply click the Date Picker button, select a date from the calendar, and the corresponding Work Summary will be displayed. Creating Task Reports You can generate Task Reports directly from your Work Summary. There are two methods for doing this: Through Timesheet Block In the Clock or Timeline View, teal-colored bars represent your worked time. 66e7ebcc9c31cGif 5 timesheet block.gif
  • Click the Worked Time bar for the period you want to report. 
  • In the Daily Reports Drawer, click the Create button from the New Task Report card. 
  • Fill in the report details, including application screenshots. 
  • Click Save to finalize your Task Report.
Through Application Block In the Clock or Timeline View, bars representing applications are displayed around the clock, with the length indicating how much time was spent in each app. 66e7ebe6bfcfeGif 6 App block.gif
  • Click the Application bar for the app you want to report on. 
  • In the Daily Reports Drawer, click the Create button from the New Task Report card. 
  • Fill in the report details, including application screenshots. 
  • Click Save to finalize your Task Report. 
Read more details on creating Task Reports. Uses of the Work Summary The Work Summary serves several purposes, benefiting both individual users and managers: 
  • Track Productivity: The Work Summary provides a clear overview of how time is spent throughout the day, including which applications are being used and how long they are used for. This helps users ensure they are staying productive and efficiently managing their time. 
  • Identify Idle Time: Idle Time bars help managers and users see periods of inactivity, making it easy to address productivity gaps or periods of downtime.
  • Visualize Task Completion: With the screenshots and keystrokes displayed, users and managers can quickly verify if critical tasks were completed during the day.
  • Generate Detailed Reports: By using the Work Summary as a starting point for creating Task Reports, users can easily compile detailed records of their workday, highlighting important tasks and activities.
  • Review Historical Data: The Date Picker allows users to review past Work Summaries, making it easier to track performance and identify trends over time.
By fully utilizing the Work Summary features, both users and managers can gain deeper insights into daily work habits, improve time management, and ensure higher productivity. 
Related articles

Resources Help Desk Blog Request a Demo Privacy Policy Terms
Contact Phone: (412) 212-3096‬ Email: support@cloudica.com   Location: Pittsburgh, Pennsylvania, USA Follow us facebook_logo linkedin_logo
Copyright © 2022 Cloudica LLC