Getting to Know Cloudica™
Welcome to using Cloudica™. We are ecstatic to have you on board.
Using the web dashboard and desktop app is simple and easy. The different monitoring and productivity features can elevate the efficiency of your virtual spaces and make remote working and collaboration a breeze.
Before we get on with this quick guide, first, identify your user role. Are you a Remote User or Manager/Owner?
For Remote Users, continue with the guide below. If you're a manager/owner, just click here.
Remote User
As a remote user, you need to be familiar with the usage of the web dashboard and the desktop app. After your registration and app installation, here are the things you will see.
Desktop App

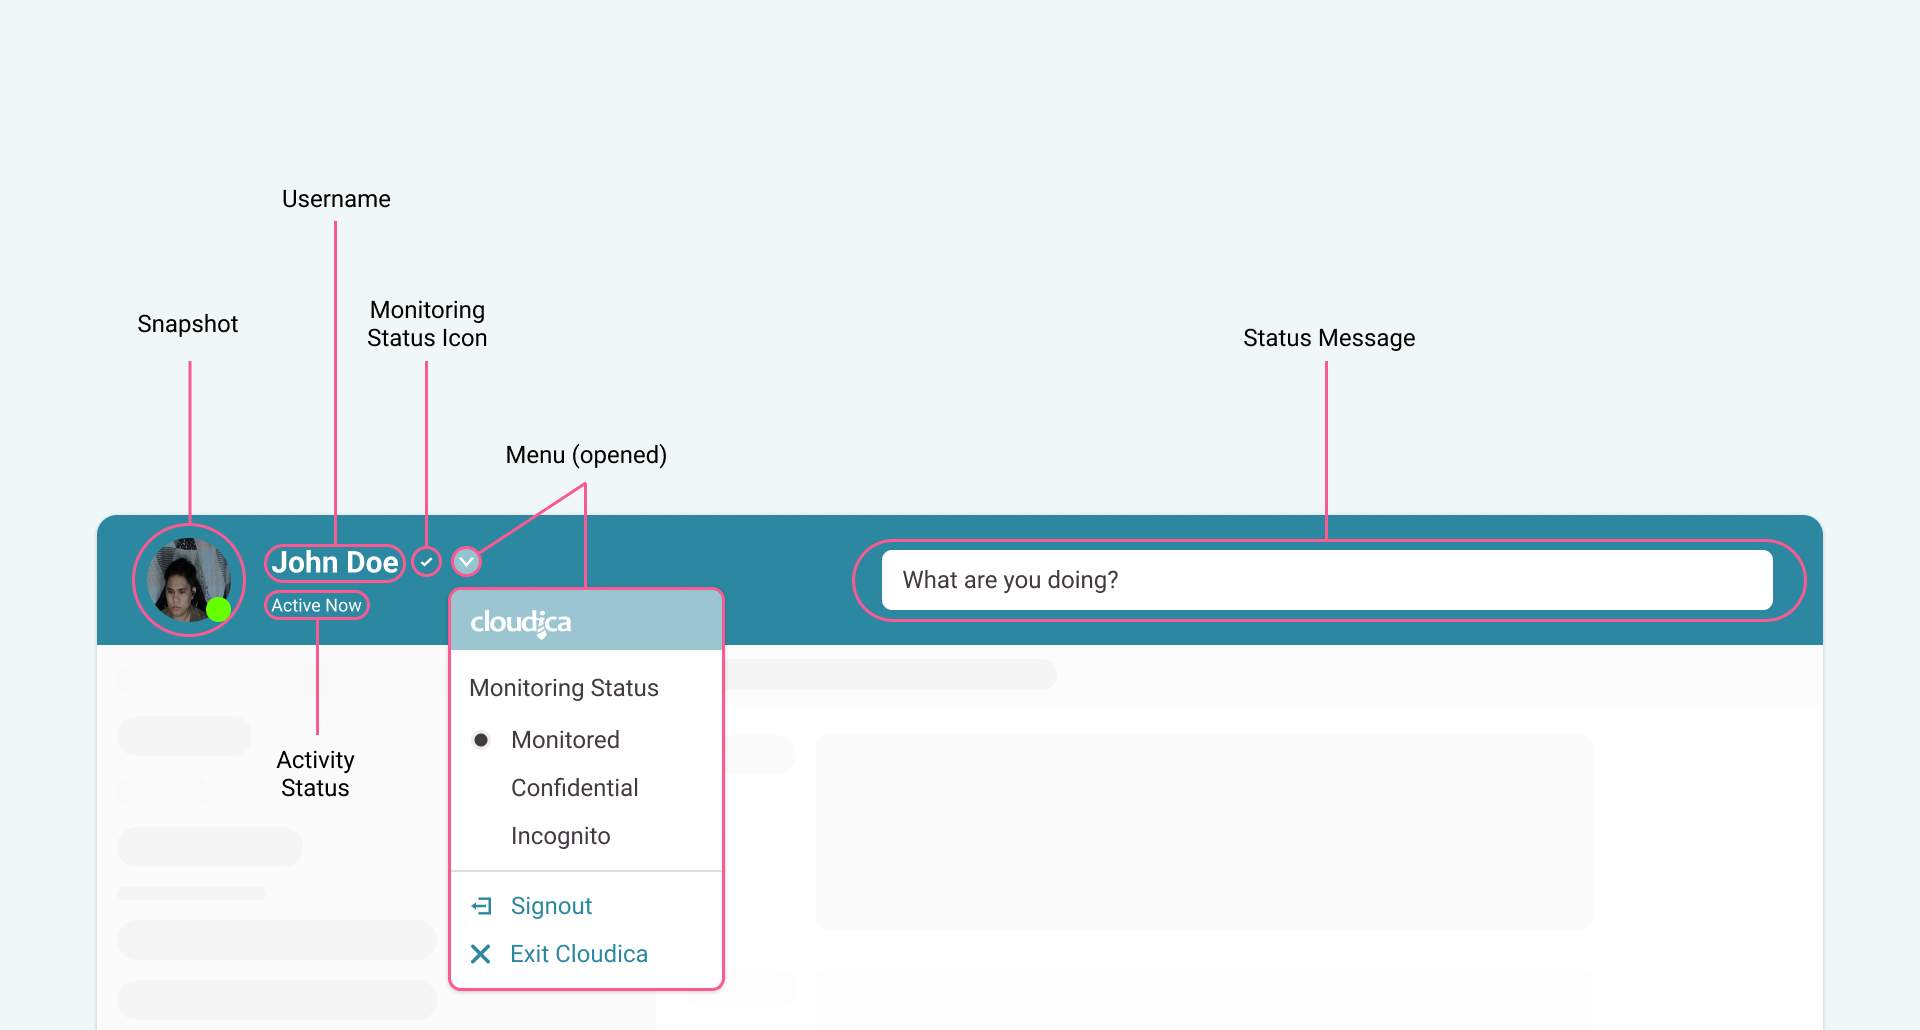
- Snapshot – Shows your latest or last snapshot taken by the app. The dot indicates if you are online (green) or offline (white).
- Username – Displays your username.
- Activity status – Indicates if you have computer activity or have been idle. If you have no computer activity, it will show the time you have been idle.
- Monitoring status icon – The icon displayed here shows your monitoring status. A checkmark for Monitoring, shield for Confidential, and hat with eyeglasses for Incognito.
- Menu – From this menu, you can change your monitoring status or Signout or Exit the app.
- Status message input – Write your status or current activity.

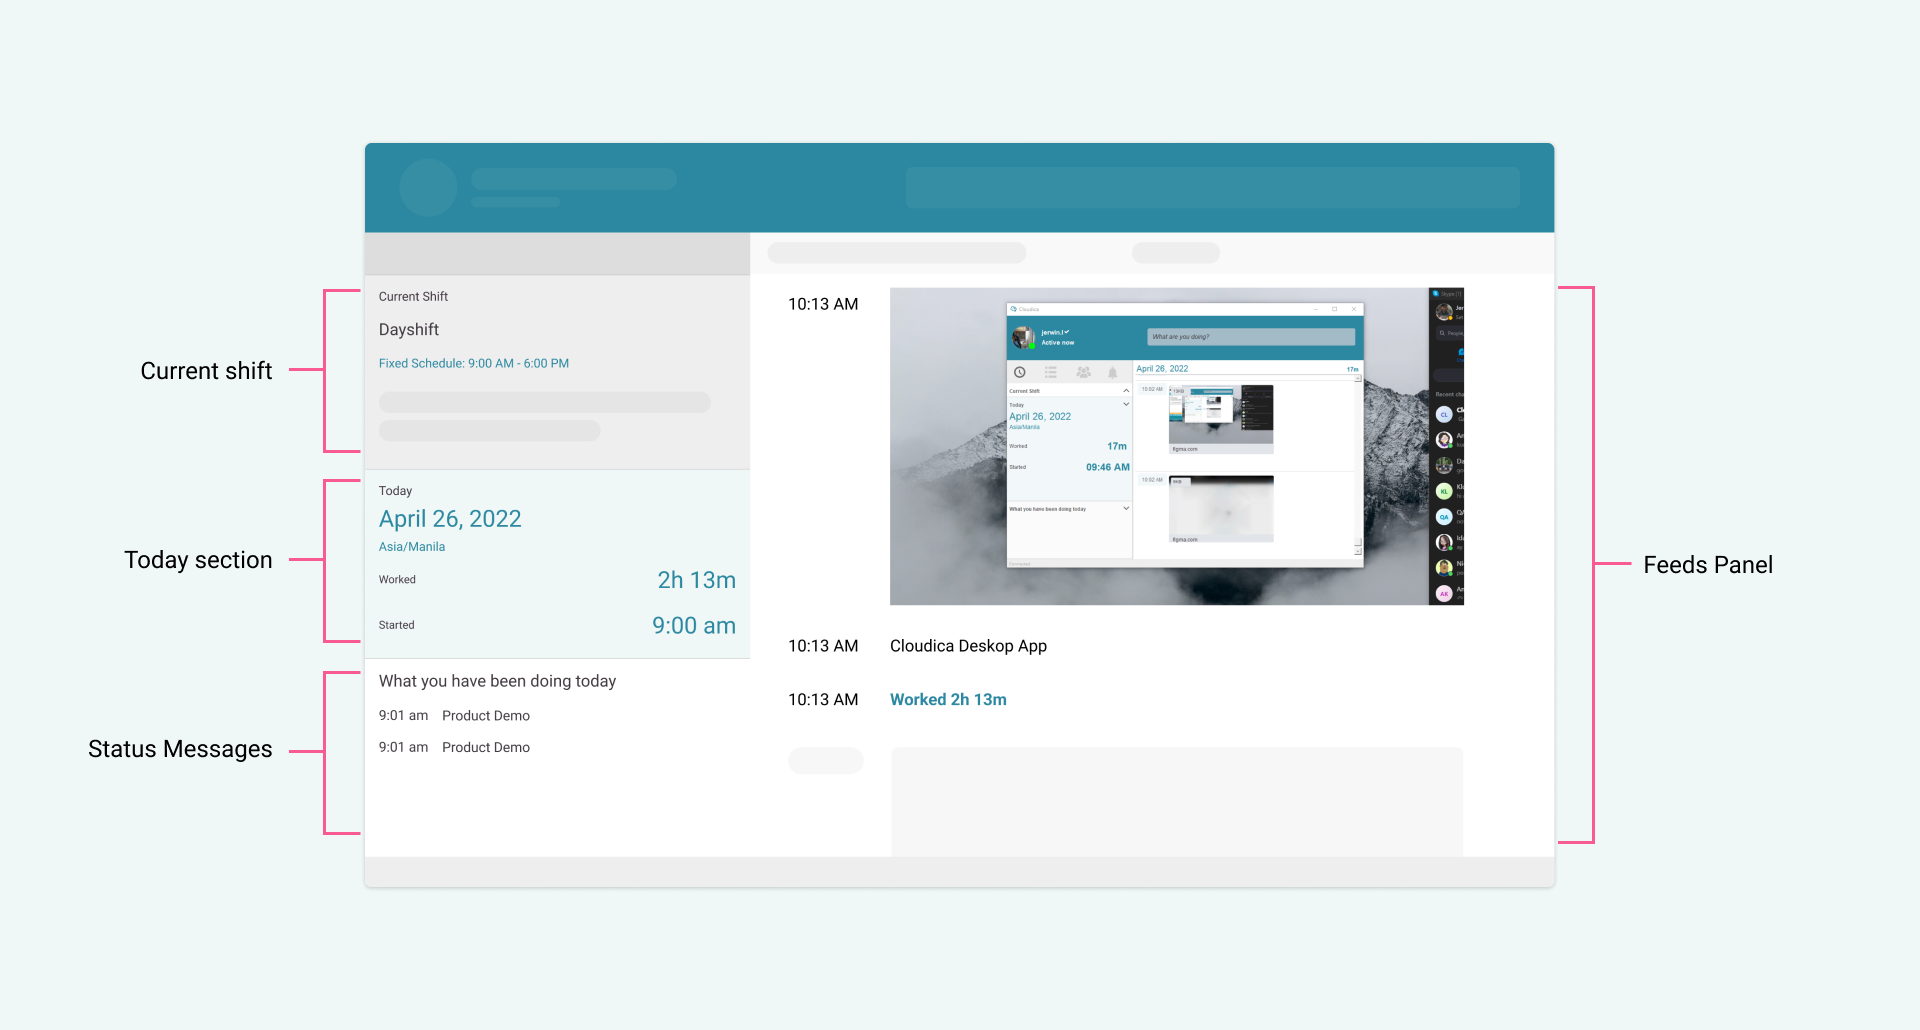
- Today Section – Shows information about your shift. The date, timezone, worked time, and time started are displayed here.
- Posted status messages – Shows the status messages you posted. You can also edit or remove your status message in this section.
- Feeds panel – Shows the real-time data being captured by Cloudica™. The panel will display the snapshots, screenshots, keystrokes, app names, URL, and worked time.
Web Dashboard
After you login to the dashboard, you will be taken to the Monitoring dashboard page.

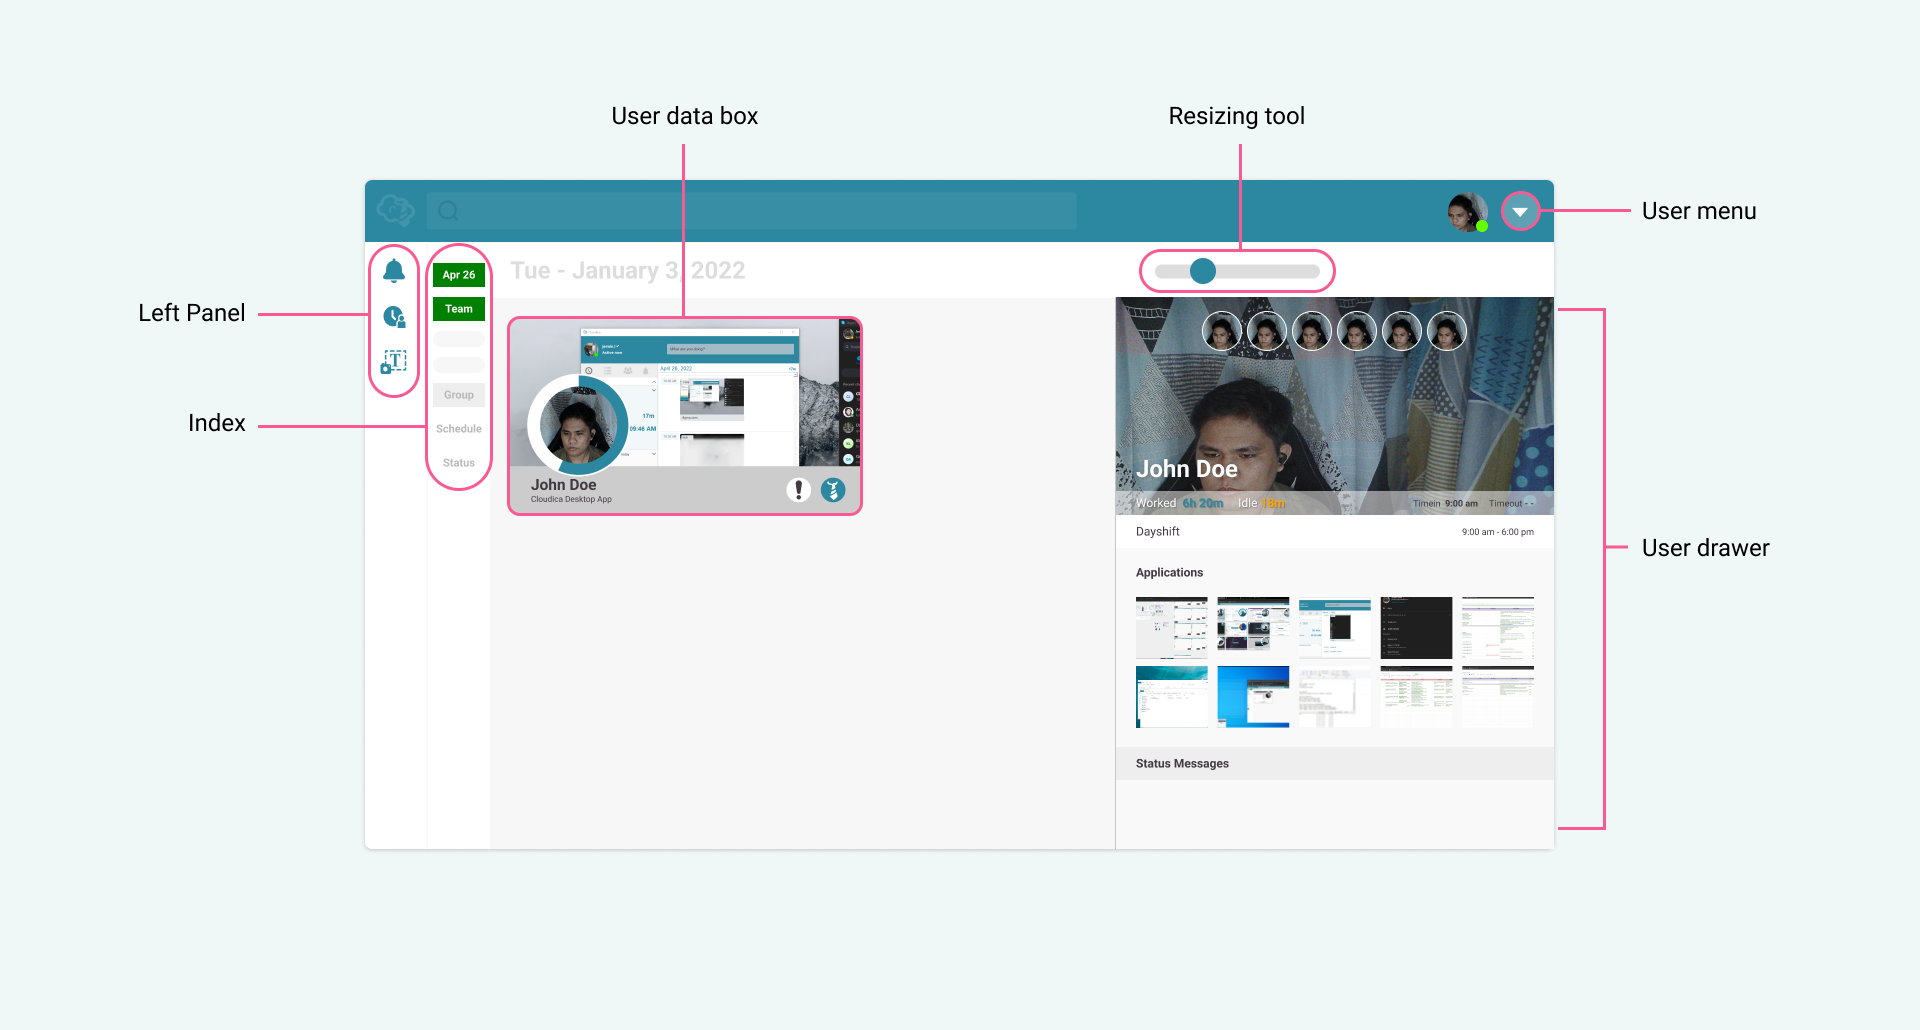
- User data box – Your user data box contains your latest snapshot, screenshot, work time, and idle time captured by the app.
- Index – Lets you view past data through the date picker. It also shows your group according to your schedule and monitoring status.
- Left panel – You can find the Notifications, Attendance Report, and the Annotated images here.
- Menu – Lets you navigate easily through the dashboard pages
- Resizing tool – Resizes the user data box
- User menu – Displays the company timezone, your account information, app download link, Tools, and logout.
- User drawer – Clicking the user data box opens the user drawer. The drawer contains the latest six snapshots, work time information, the latest 10 screenshots, and your posted status messages.
Check out the Virtual Workspace quick guide.
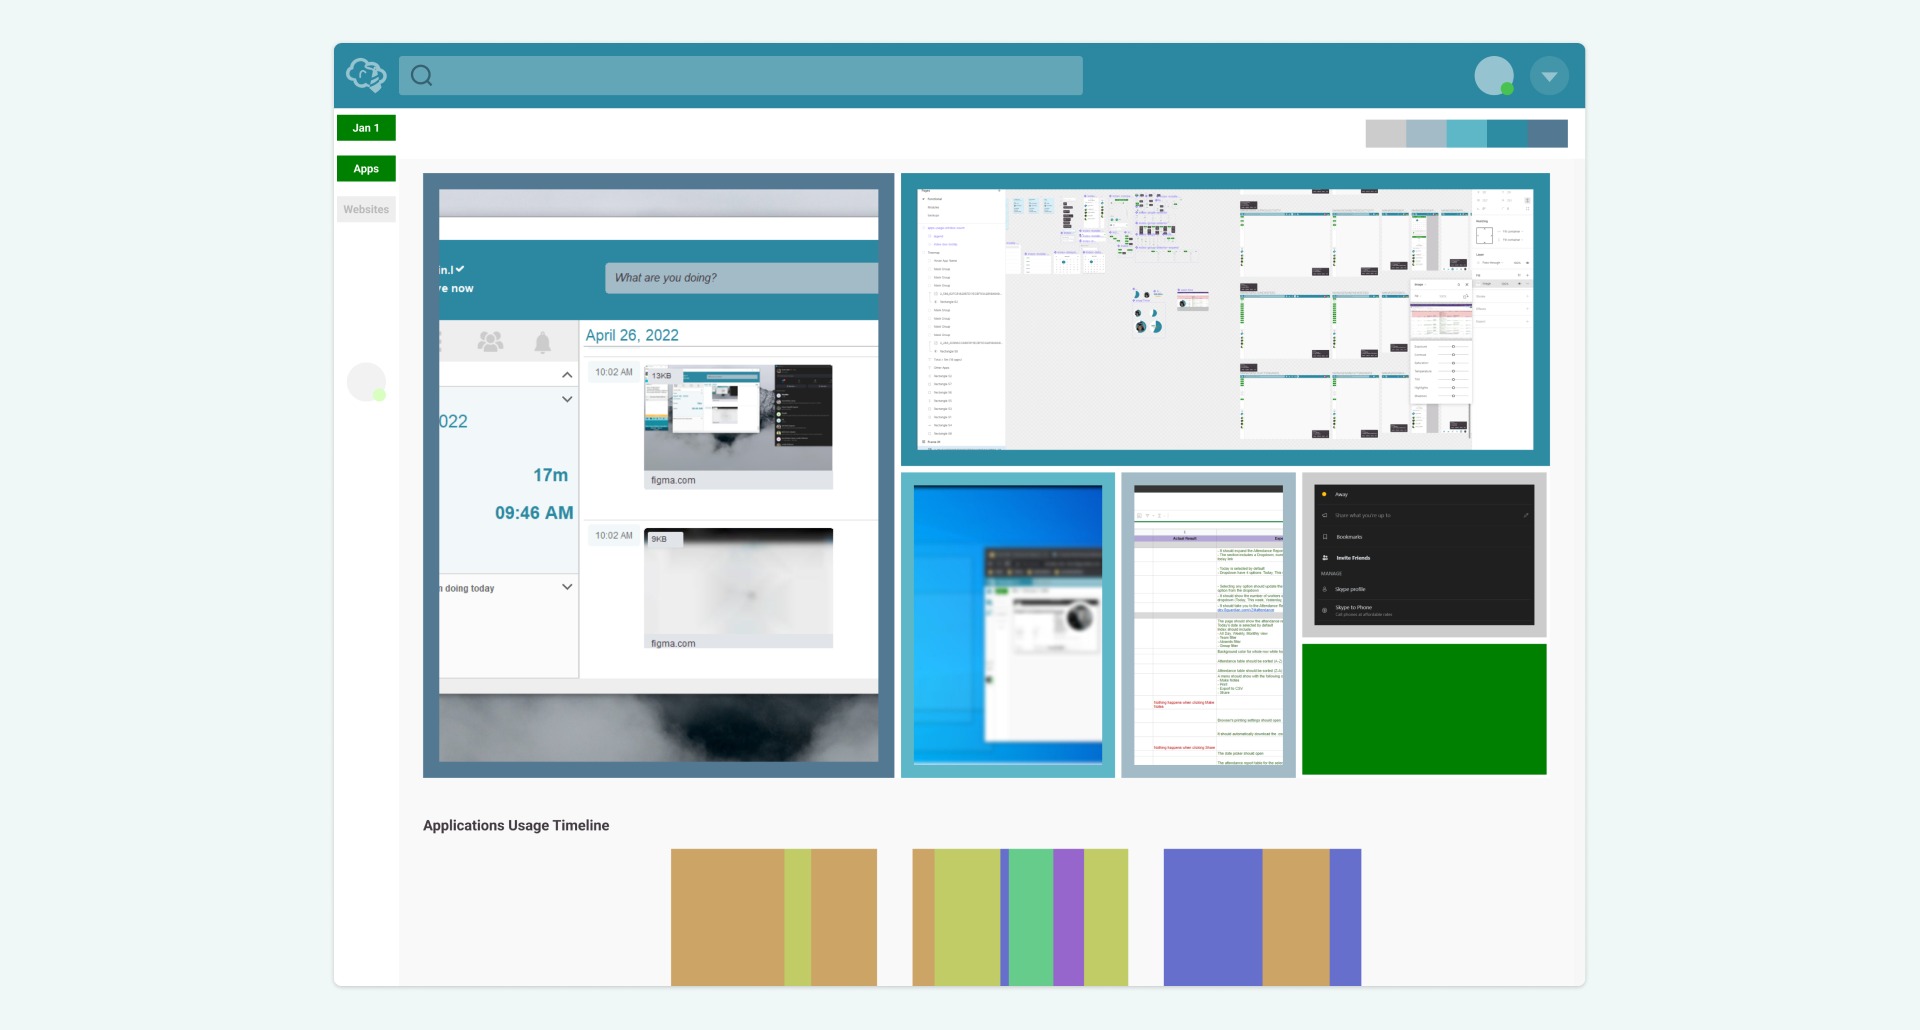
Monitor your app usage
- Know how much time you spend on the applications and websites you use and make effective adjustments.
- Check your hourly keystrokes count.
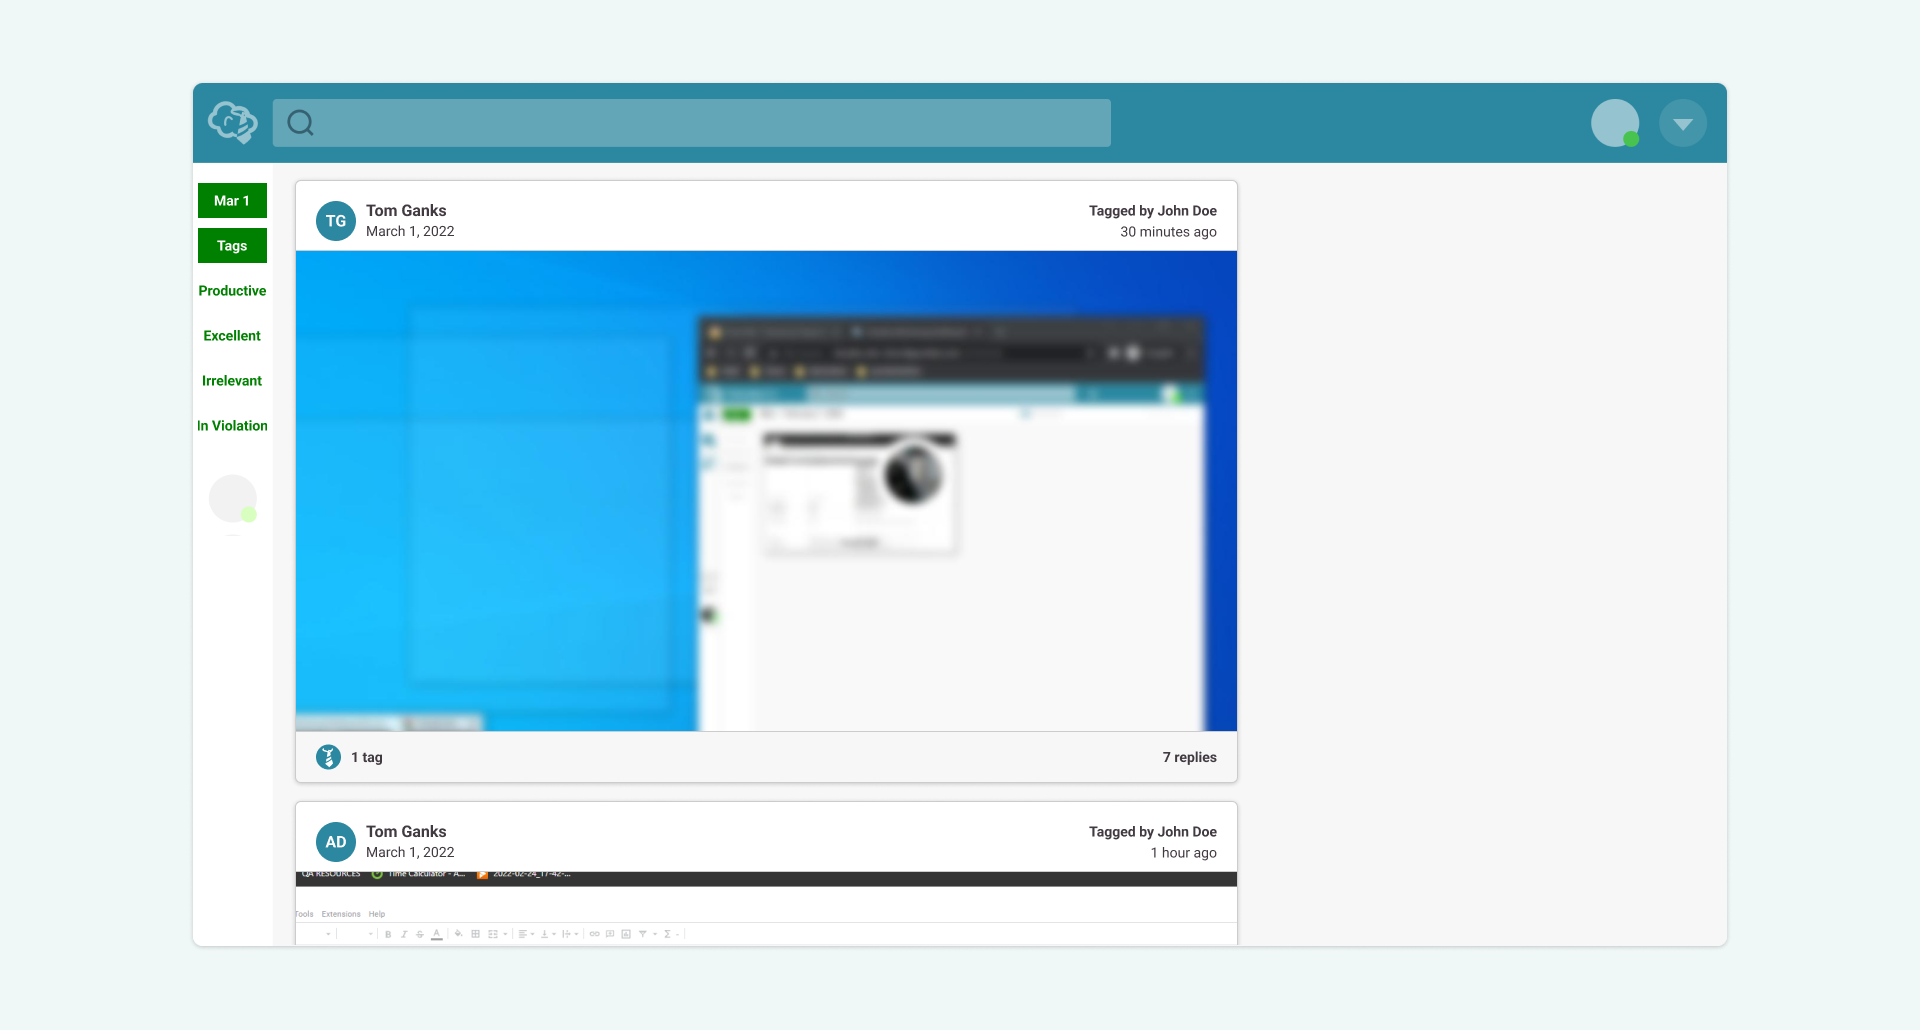
 Check for productivity feedback
- See the tagged feedback items from your manager.
- Give your response and discuss opportunities and improvements.
 Share your newsfeed
- Let your clients, teammates, or manager know what you are doing.
- Get instant feedback from your mentor or trainer as you broadcast your newsfeed.

Copyright © 2025 Cloudica LLC
