Desktop App
Welcome to the quick guide for the Cloudica™ Desktop App, the tool designed to capture essential data for monitoring and enhancing the productivity of remote users. Follow this guide for a smooth experience.
Installation
User Header
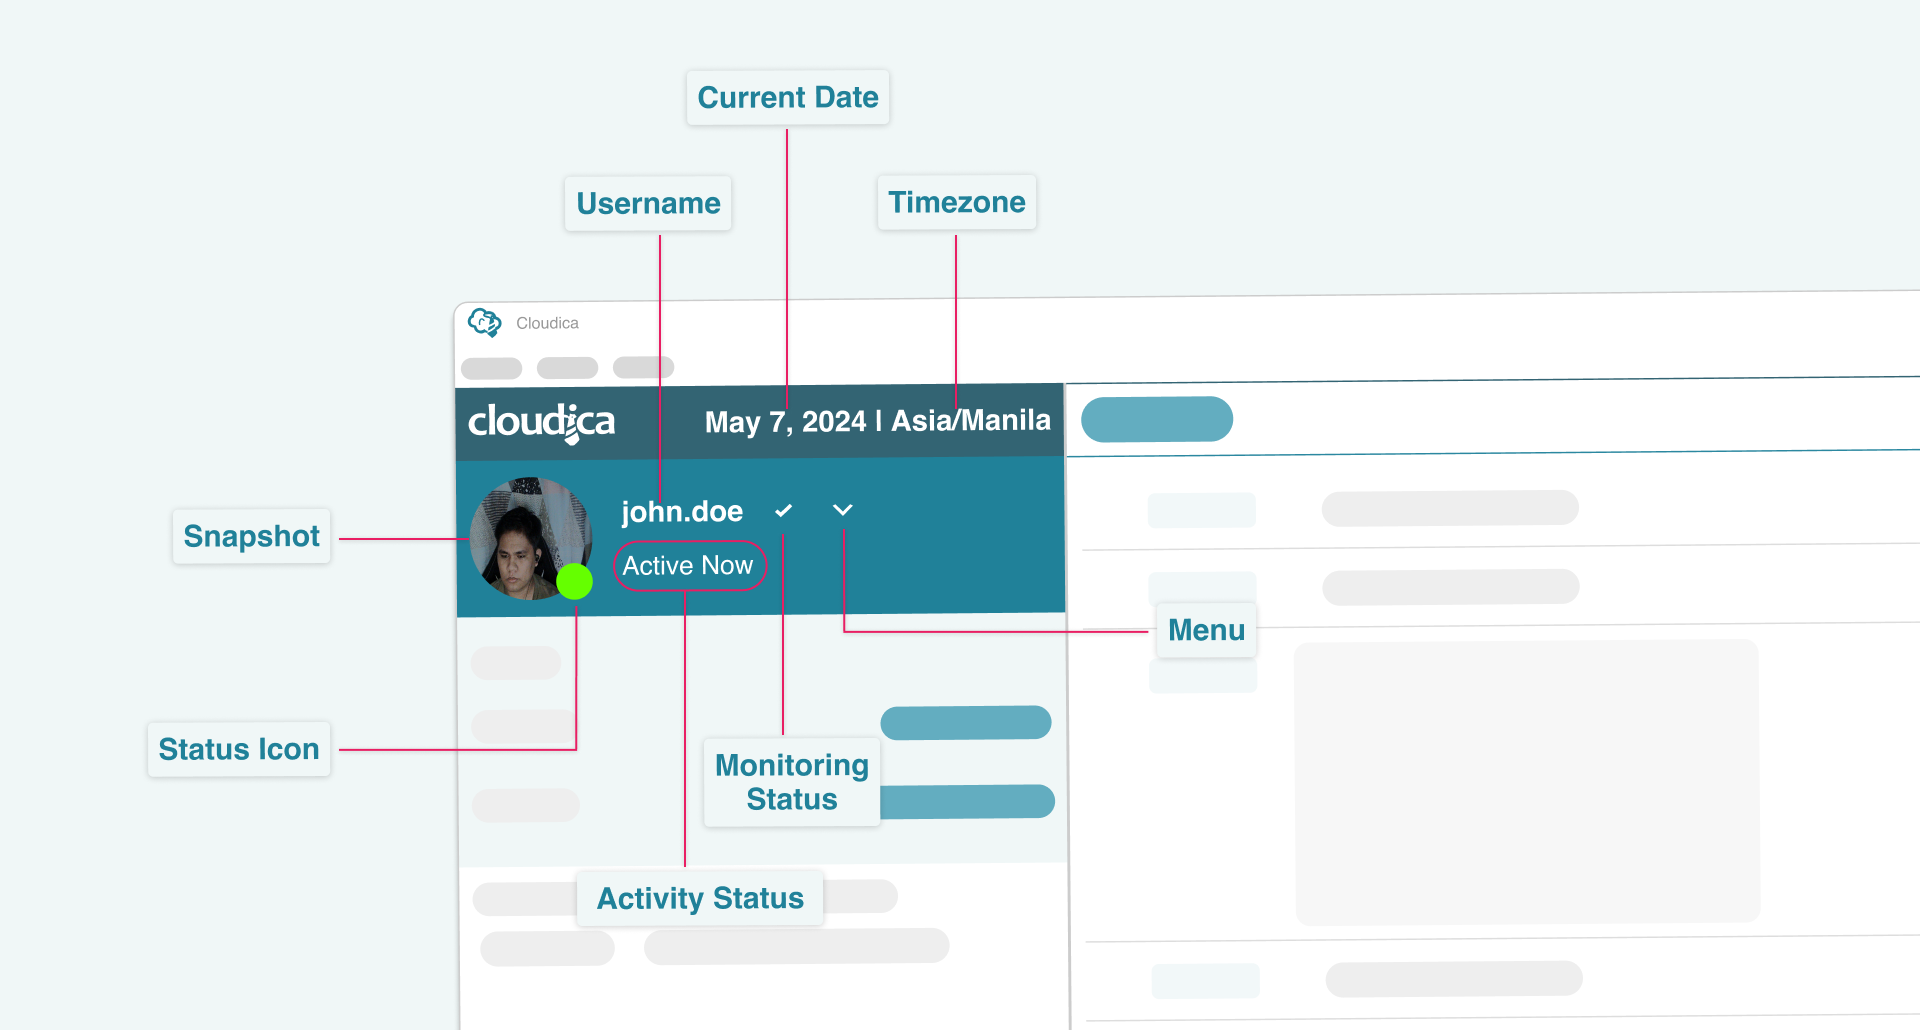
The User Header consists of the following:
- Snapshot Displays your latest or last snapshot taken by the app.
- Status Icon Indicates online (green) or offline (white) status.
- Username Shows who is logged in.
- Activity Status Indicates computer activity or idle time.
- Monitoring Status Icon Reflects your monitoring status (Monitoring, Confidential, Incognito).
- Menu Access for changing monitoring status, signing out, or exiting the app.
- Current Date & Timezone Displays the present date and company timezone.
 Left Panel
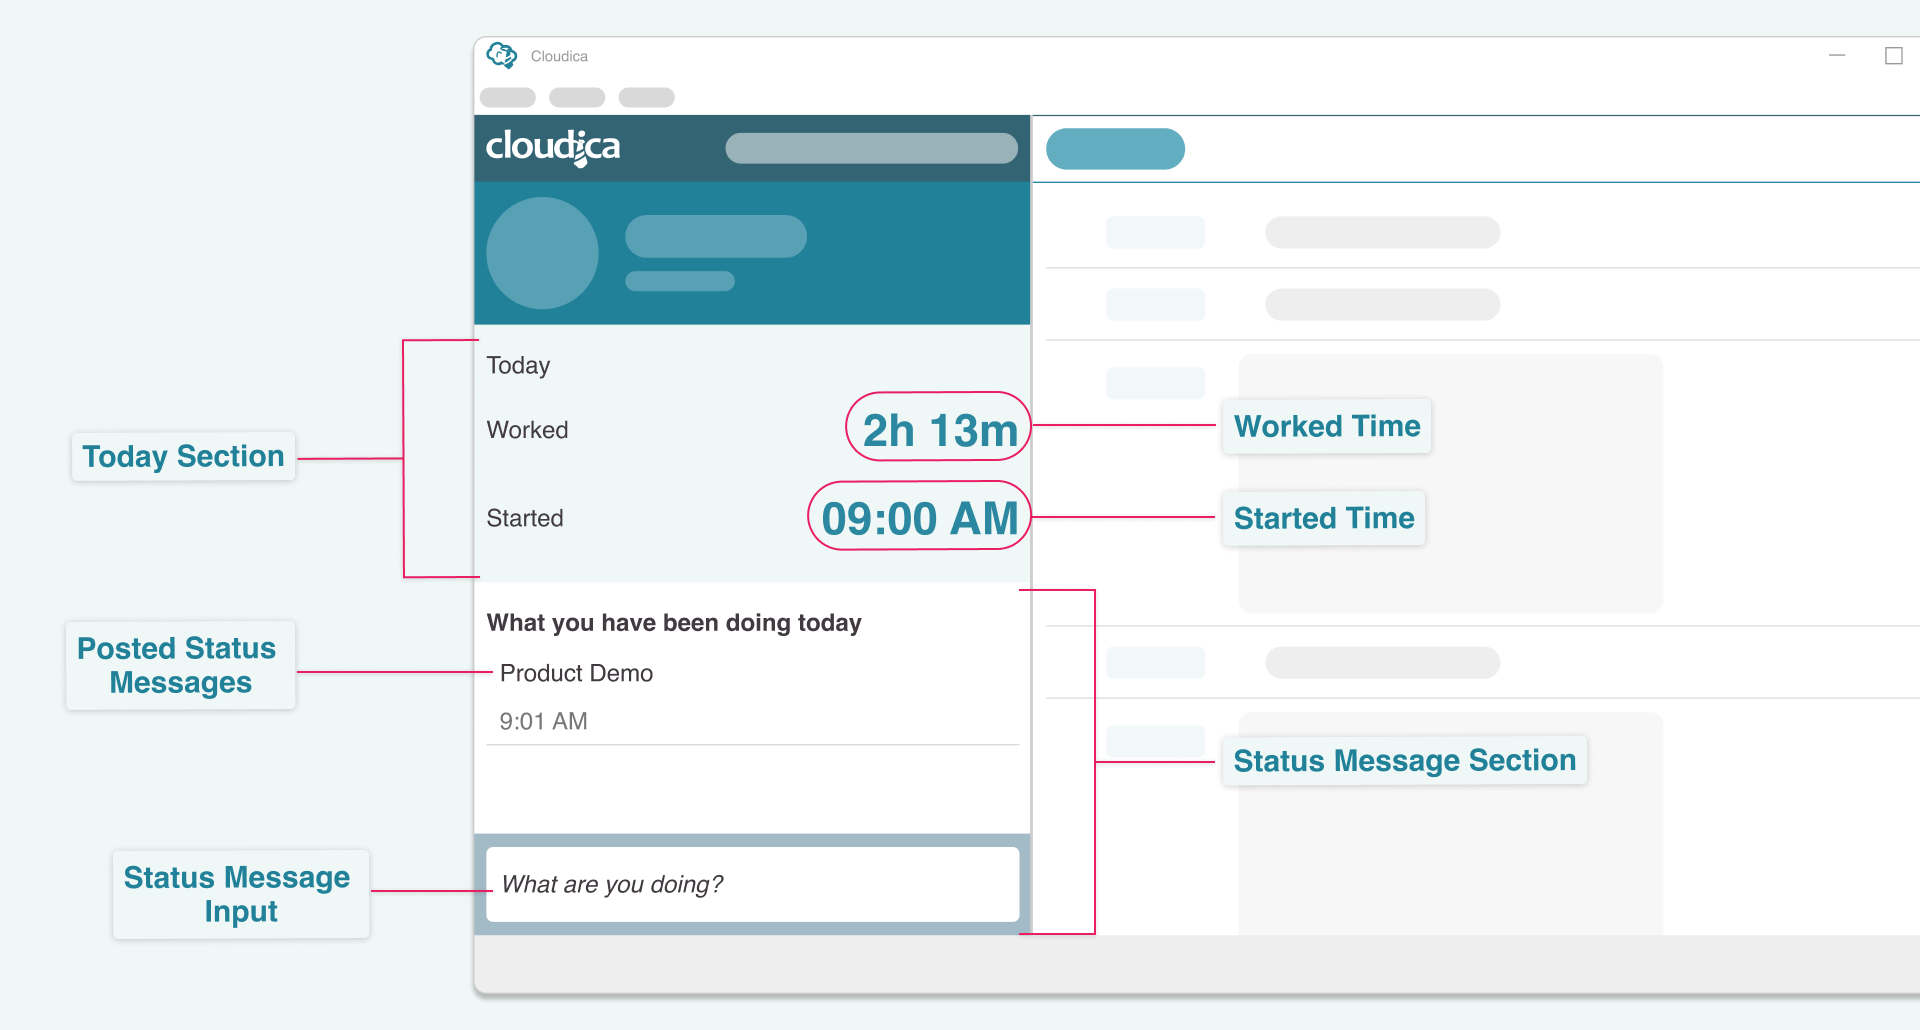
Under the User Header are two sections to the Left Panel. They are the:
Today Section:
- Worked TimeDuration the Desktop App has monitored your computer activities.
- Started TimeTime of initial login to the app for the day.
Status Message Section:
- Posted Status Messages Shows status messages posted during your day. Edit or remove messages as needed.
- Status Message Input Write your current status or activity. Can also be posted from the Cloudica™ web dashboard.
 Feeds Panel
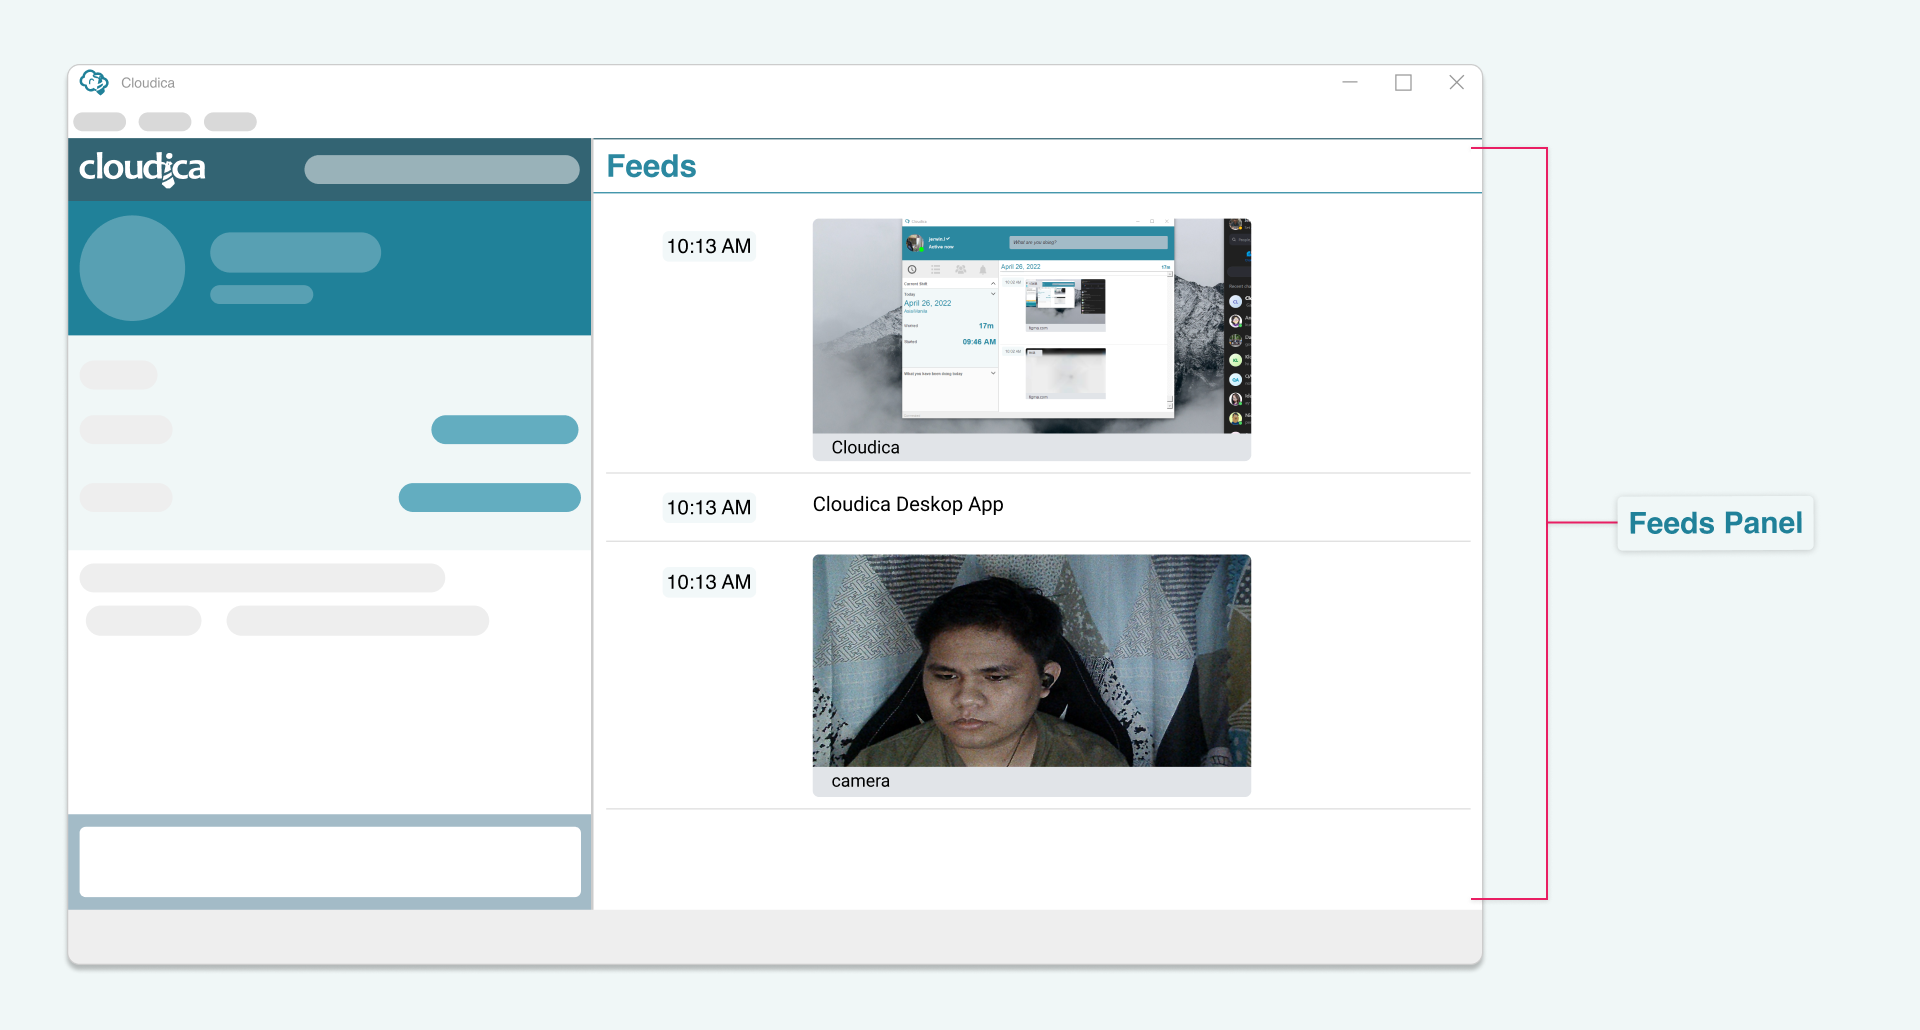
On the right side of Cloudica™ application is the Feeds Panel. Here you can see the real-time data captured by the Cloudica™ Desktop App.
The panel will display the following:
- Snapshots
- App/Window Screenshots
- Fullscreen Screenshots
- Keystrokes
- App Names
- URLs
- Idle Time
 All data captured is curated in the Cloudica™ web Dashboard Application for further analysis and monitoring.
- Posted Status Messages Shows status messages posted during your day. Edit or remove messages as needed.
- Status Message Input Write your current status or activity. Can also be posted from the Cloudica™ web dashboard.
Copyright © 2024 Cloudica LLC
